Using Graph Analysis
Graph Analysis is the backbone to graphing polynomials. There are a variety of different polynomials available to graph and analyzing these functions before starting a graph will provide a generic picture of what that graph should look like. Furthermore, it provides general points and references that simplifies the graphing process. Graph analysis consists of determining zeros, understanding the end behavior, identifying the number of possible turn points, and finding the y-intercept. All these concepts allow for the development of a simplified table taking some of the error out of graphing complex functions. Follow the steps below to completely graph a polynomial function. Remember some of these skills are not needed for some of the more basic functions, such as Linear and Quadratic function. However, they can assist if needed.
Steps to Graphing Polynomials
1. Find all Zeros
2. Identify the y-Intercept
3. Determine the number of Possible Turn Points
4. Identify the End Behavior of the Polynomial
5. Create a table
6. Graph the Polynomial
2. Identify the y-Intercept
3. Determine the number of Possible Turn Points
4. Identify the End Behavior of the Polynomial
5. Create a table
6. Graph the Polynomial
Example of Graphing Polynomials

Steps 1-4 of Graphing Polynomials. These are the analysis phase of Graphing.
|
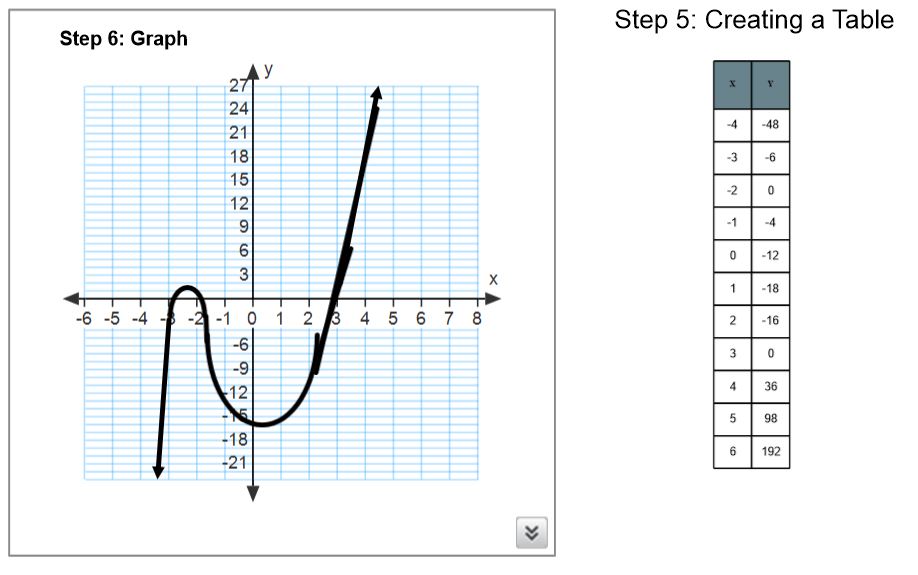
Steps 5 and 6 of Graphing Polynomials. Always calculate a table.
|
